Prometheus
一,基本安装
Prometheus是一款开源的监控系统与时间序列数据库,想要学习一下的目的是:了解一下如何做一个可视化的应用监控系统。
- Prometheus:负责数据采集、存储和告警规则计算,通过HTTP暴露/metrics接口提供数据。
首先需要下载Prometheus并进行安装,我这边是解压到了/usr/local文件夹下
rz  prometheus-2.24.1.linux-amd64.tar.gz  上传到服务器
tar -xvf prometheus-2.24.1.linux-amd64.tar.gz  -C /usr/local/   将prometheus解压到/usr/local文件夹下
进入到解压后目录,可以看到文件夹中的内容
drwxr-xr-x 28 root root      4096 May 14 16:48 data
-rw-r--r--  1 1001  118     11357 Mar 26 21:08 LICENSE
-rw-r--r--  1 1001  118      3773 Mar 26 21:08 NOTICE
-rwxr-xr-x  1 1001  118 153799457 Mar 26 20:50 prometheus
-rw-r--r--  1 1001  118      1597 Apr  8 16:20 prometheus.yml
-rwxr-xr-x  1 1001  118 145482140 Mar 26 20:50 promtool
其中的prometheus就是我们的执行脚本,通过如下命令启动prometheus,指定对应的配置文件prometheus.yml
./prometheus --config.file=./prometheus.yml --web.enable-lifecycle &
也可使用守护进程进行启动
nohup ./prometheus --config.file=./prometheus.yml --web.enable-lifecycle &
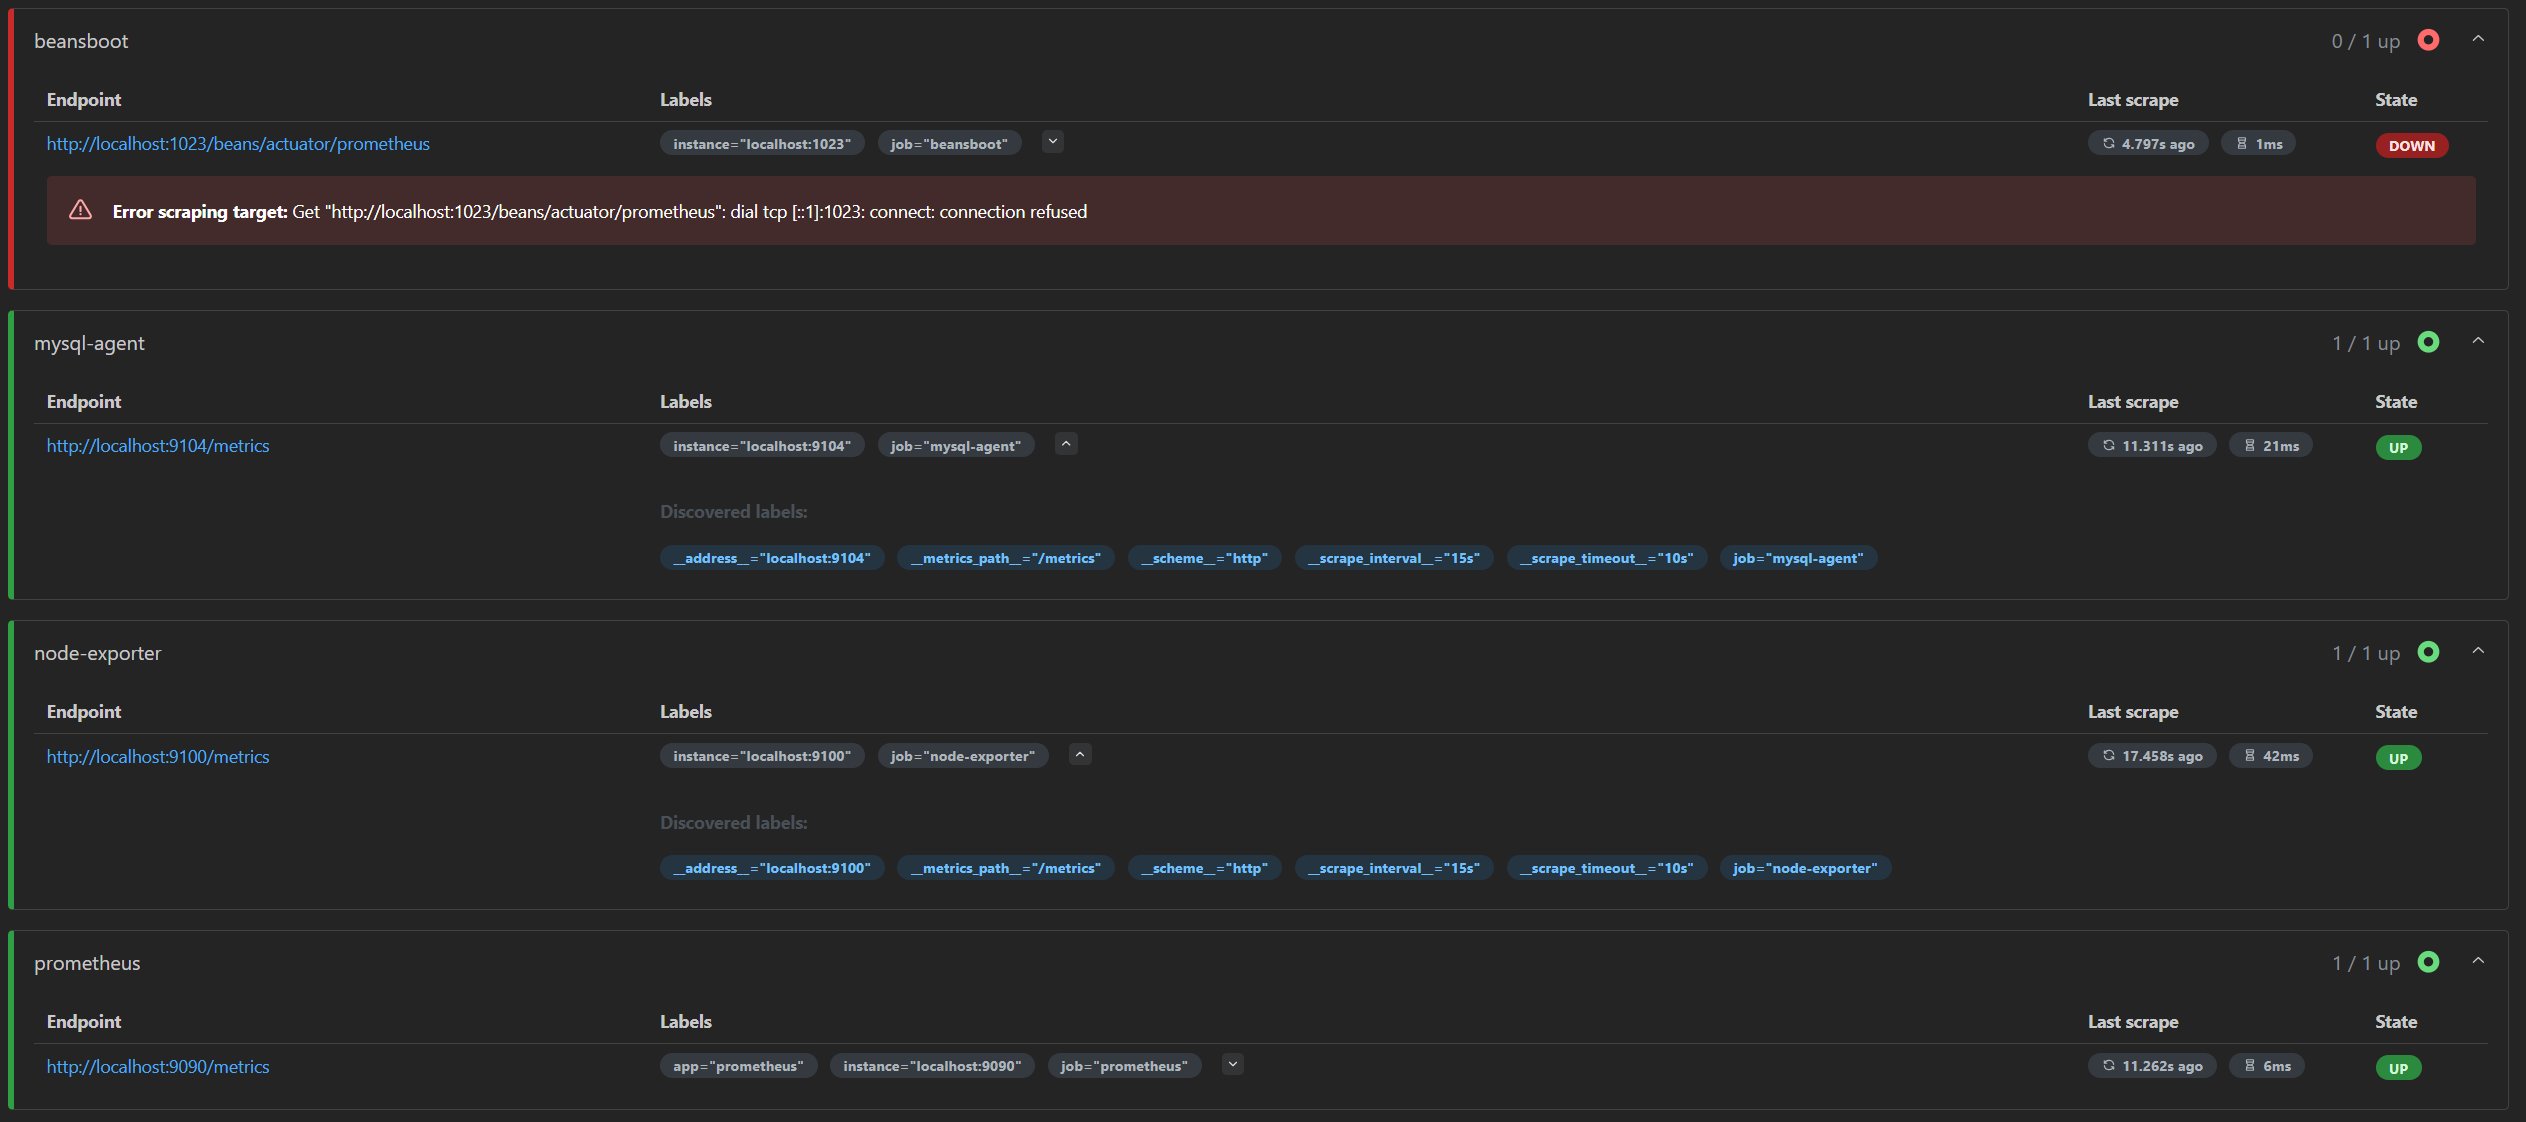
到此prometheus就启动完毕,可以通过ip:9090进行访问。但是进去什么也没有,因为我们还没有通过prometheus监控服务。
二,监控工具
Prometheus中对应的监控工具有很多,我这边只添加了两个核心的监控工具node_exporter和mysqld_exporter
官网(用于下载监控工具):https://prometheus.io/download/
node_exporter
node_exporter是Prometheus 官方提供的 Linux 主机指标采集器,通过暴露 HTTP 端点(默认 9100)供 Prometheus 抓取数据。
下载对应的压缩包后进行解压,我这边也是解压到/usr/local/文件夹下
tar -xvf node_exporter-1.9.0.linux-amd64.tar.gz -C /usr/local/
// 运行node_exporter
nohup ./node_exporter --web.listen-address=":9100" > nohup.log 2>&1 &
解压以后需要在prometheus的配置文件中将对应的结点添加上去
vim prometheus.yml
// 添加对应的服务
scrape_configs:
  # The job name is added as a label `job=<job_name>` to any timeseries scraped from this config.
  - job_name: "prometheus"

    # metrics_path defaults to '/metrics'
    # scheme defaults to 'http'.

    static_configs:
      - targets: ["localhost:9090"]
       # The label name is added as a label `label_name=<label_value>` to any timeseries scraped from this config.
        labels:
          app: "prometheus"
  // 任务名称
  - job_name: "node-exporter"
    static_configs:
      - targets: ["localhost:9100"] // 运行地址
mysqld_exporter
mysqld_exporter的操作与node_exporter一样,也是需要在prometheus的配置文件中将对应的结点添加上去
scrape_configs:
  # The job name is added as a label `job=<job_name>` to any timeseries scraped from this config.
  - job_name: "prometheus"

    # metrics_path defaults to '/metrics'
    # scheme defaults to 'http'.

    static_configs:
      - targets: ["localhost:9090"]
       # The label name is added as a label `label_name=<label_value>` to any timeseries scraped from this config.
        labels:
          app: "prometheus"
  // 任务名称
  - job_name: "node-exporter"
    static_configs:
      - targets: ["localhost:9100"] // 运行地址
  - job_name: "mysql-agent"
    static_configs:
      - targets: ["localhost:9104"]
  - job_name: "beansboot"
    scrape_interval: 15s
    scrape_timeout: 10s
    metrics_path: "/beans/actuator/prometheus"
    static_configs:
      - targets: ["localhost:1023"]
springboot服务
除了Prometheus提供的监控工具,我们还可以用Prometheus监控springboot项目。首先需要在对应的springboot项目中安装对应的历来依赖用于暴露端点指标数据
 <dependency>
            <groupId>org.springframework.boot</groupId>
            <artifactId>spring-boot-starter-actuator</artifactId>
        </dependency>
        <dependency>
            <groupId>io.micrometer</groupId>
            <artifactId>micrometer-registry-prometheus</artifactId>
        </dependency>
启动服务后需要在prometheus的配置文件中将对应的结点添加上去
  - job_name: "beansboot"
    scrape_interval: 15s
    scrape_timeout: 10s
    metrics_path: "/beans/actuator/prometheus" // 指标路径
    static_configs:
      - targets: ["localhost:1023"]   // 服务运行ip和端口号
经过上述操作后在通过访问ip:9090便可看到监控的服务了